Lets be honest! Using Google Analytics can be incredibly confusing because it provides so much information, in so many categories, on how people interact with your web site. Worse still Google Analytics can make you feel really depressed if you misinterpret your statistics.
So lets get our hands dirty and learn the basics of how to use Google Analytics to monitor visitors to your blog. Refer to Setting up Google Analytics if you haven’t yet set up Google Analytics for your blog.
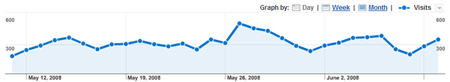
Visits Graph
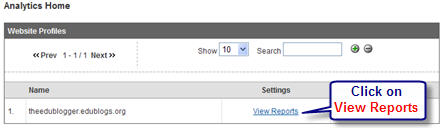
You access your Google Analytics dashboard by logging into your Google Analytics using your gmail account and clicking on View Reports.
Your dashboard default displays your statistics for the past month.
At the top of your dashboard is your graph which shows the number of visits to your site per day. Hovering over each dot on your graph displays the number of visits for that date. Visits are the individual sessions initiated by all the visitors to your site. If a person leaves your site and return within 30 minutes it is counted as part of the original session.
Don’t be upset if your visits per day are low; remember Google Analytics only provides statistics on readers who are visiting your blog — these are only some of your readers. Most of your readers read your blog in feed readers and you track statistics of these readers using Feedburner.
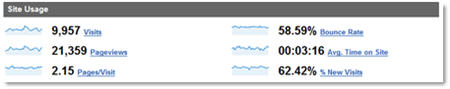
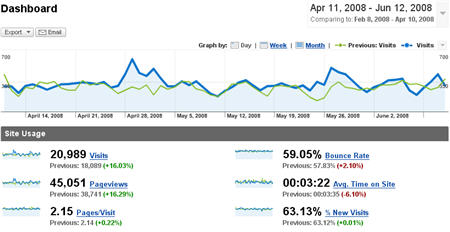
Site Usage
Site usage are summary statistics on how visitors are interacting with your blog. Here is simple explanation of what each means:
- Visits – the number of times someone interacted with your blog i.e. the number of individual sessions initiated by all the visitors to your site (if a visitor returns within 30 minutes their visit is counted as part of the original session)
- Bounce Rate – the percentage of people who instantly left your blog i.e. your content didn’t interest them so left immediately
- Pageviews – how many pages of your blog they viewed during their visit
- Average time on site – average time a visitor spent on your blog
- Pages/Visit – Average number of page views per visit
- New Visits – the number of new visitors to your blog
Limitations of Site Usage Statistics for Blogs
You need to remember when viewing statistics provided by Google Analytics that it is designed to track visitors to various types of website, not just blogs; company websites use it to track performance of their marketing campaigns and to optimise their website.
How people interact with blogs is quite different from other types of websites; people usually read the latest posts and then leave. So statistics like bounce rate and average time on site aren’t necessarily a good measure of quality for blogs.
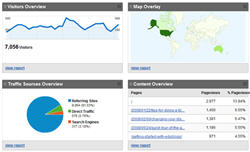
Dashboard Reports
Your dashboard default report summaries, below your Visit graph and Site Usage, are:
- Visitor Overview
- Map Overview
- Traffic Source Overview
- Content Overview
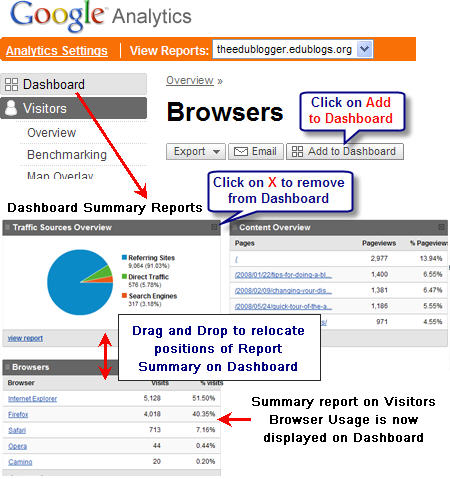
You can change what report summaries are displayed on your dashboard by :
- clicking on the X at the top-right of the report summary to remove
- clicking on the report summary and dragging it to the desired location on your dashboard to change its position
- When you are reading a report, that you want to add to your dashboard, click Add to Dashboard at top left (directly below the report title)
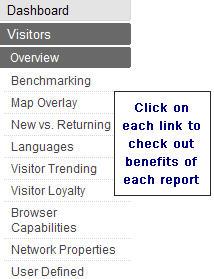
Dashboard Sidebar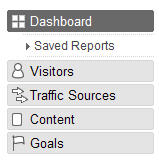
Clicking on Visitors and Traffic Sections in the left sidebar of your dashboard expands your report options for analyzing your blog’s statistics.
Take the time to check out each report option and follow each link to drill down into specifics (e.g. referring sites, top content) – to start to get a feel for what it all means to you.
Date Range
Although your dashboard default displays your statistics for the past month you can change your date range. You can also compare date range with previous date range to see how visits to your blog have changed over time (Tip: When I use different date ranges I make sure that my start dates for each range are the same day of the week).
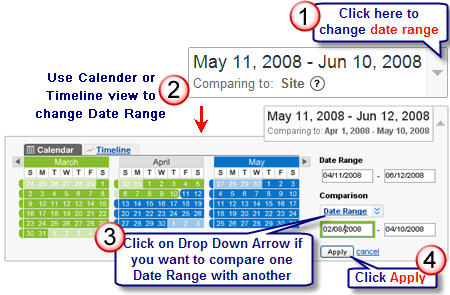
Below is the results of comparing two different date ranges of two months.
The first date range selected is displayed on the graphs as blue lines and the second date range is shown as green. Tabulated data displays positive differences as green and negative as red. For example Visits to site increased by 16.01 % while Bounce Rate got worse by 2.09 % .
Analyzing Traffic Sources
 Traffic source is important because it tells you how people are coming to your blog.
Google Analytics has four traffic source categories:
- Direct Traffic – visitors that type your blog URL into their web browser or have your site bookmarked.
- Referring Traffic – other websites or blogs referring visitors to your site.
- Search Engines – visits to your site based on people typing key words into a search engine e.g. Google, Yahoo, MSN.
- Other – visits by people referred by emails, newsletters etc
Referring Traffic
Referring traffic is often the main traffic source for blogs so it’s important to take the time to regularly check out your top referring sites (on your dashboard sidebar click on Traffic Sources > Referring Sites). This is a good way of identifying sources that you didn’t realise are sending traffic to your blog. I will often visit the referring pages to check out why they are referring.
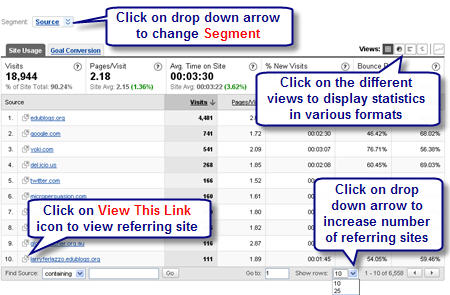
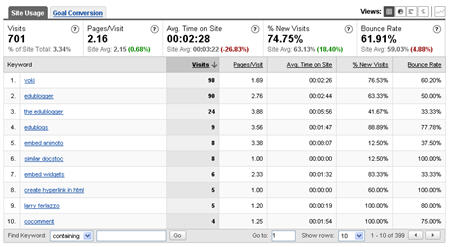
Search Engines
The simplest method of analysing traffic from search engines is checking your Keywords statistics (on your dashboard sidebar click on Traffic Sources > Keywords).
A high Bounce Rate such as 100 % indicates that a visitor used that search term in a Search Engine but your content wasn’t what they were looking for. For example keyword “The Edublogger” had a bounce rate of 33.33 % which implies the visitor was probably searching for this blog whereas the keyword “similar docstoc” bounce rate was 100 %.
Analyzing Visitors
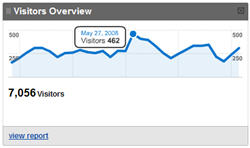
Google Analytics provides on both Visits and Visitors; which can be confusing if you don’t realize the difference.
Visitors are the number of unique people who visit your blog for that time period e.g. on that day. Whereas visits are the number of individual sessions initiated by all the visitors to your site (if a visitor returns within 30 minutes their visit is counted as part of the original session).
For example on May 27, 2008 The Edublogger had 462 visitors and 521 Visits (i.e. a few of visitors returned several times during the day to the blog).
 The Visitor section offers an extensive range of reports — you need to your time to check out each link in the visitor section to start to get a feel for what it all means to you.
Analyzing Content
The Content section provides the statistics that help you determine:
- Popularity of posts – using either Top Content or Content by Title reports
- Which posts are most visitors landing on when they visit your blog – using Top Landing Pages reports
- Which posts are most visitors leaving your blog – using Top Exit Pages reports
These content reports are very important: they help you work out the types of posts that appeal to your readers. Your Top Landing Pages report is one situation where you would use Bounce Rate to determine whether content is meeting the needs of your readers.
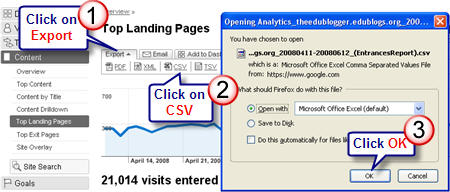
One of the best aspects of all reports generated by Google Analytics is you can export them as PDF, XML, CSV (format for Microsoft Excel) or TSV (format that can be read in most spreadsheet applications or text editors). This is really helpful for doing your own analysis or using the information in blog posts.
FINAL THOUGHTS
I’ve tried to cover the basics of Google Analytics. This is definitely one online tool that you need to spend time fiddling with to understand how to use.
I strongly recommend you check out the following video tutorials created by Google to learn more about using Google Analytics:
With so much to cover I’m definitely bound to have missed some of your favorite aspects of using Google Analytics so would love to hear:
- How you use it to analyze your blog’s traffic.
- What are the 5 top statistics you check when using it?
If you are enjoying reading this blog, please consider  Subscribing For Free!
The first thing I look at is the month over month change in visitor traffic. Then I look at yesterday’s traffic and compare it to the same day of the previous week. Then I compare this month’s daily pattern to last year’s for the same period of time, making sure to line up for the days of the week. I wish there was a faster way to do this. The big statistic I look at is search engine, nonpaid traffic to see how our SEO efforts are progressing.